

 Right curriculum - to have you covered
Module 1 - Introduction
- Why Art of Problem Solving is Important?
- Problem Formulation Framework
- How to identify the right problem to solve
- Framework to understand all the possible root causes of the business problem
- End questions to answer with the Data Analysis.
Module 2 - Retail Case Study (Application 1)
- Understanding everything about the Retail Domain.
- Application of problem solving framework in Retail business case study.
Module 3 - Insurance Case Study(Application 2)
- Understanding everything about the Insurance domain.
- Application of problem solving framework in insurance business case study.
Module 4 - Banking Case Study (Application 3)
- Understanding everything about the Insurance domain.
- Application of problem solving framework in banking business case study.


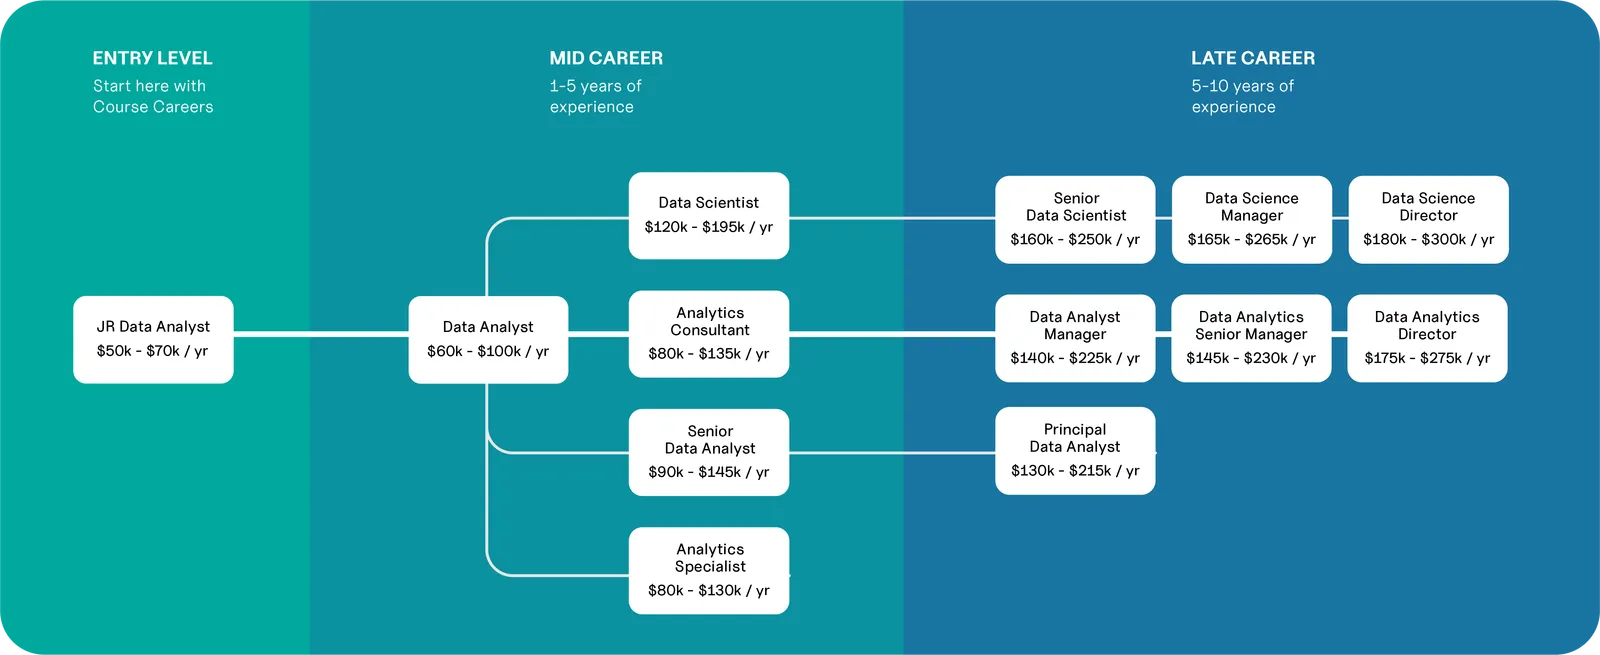
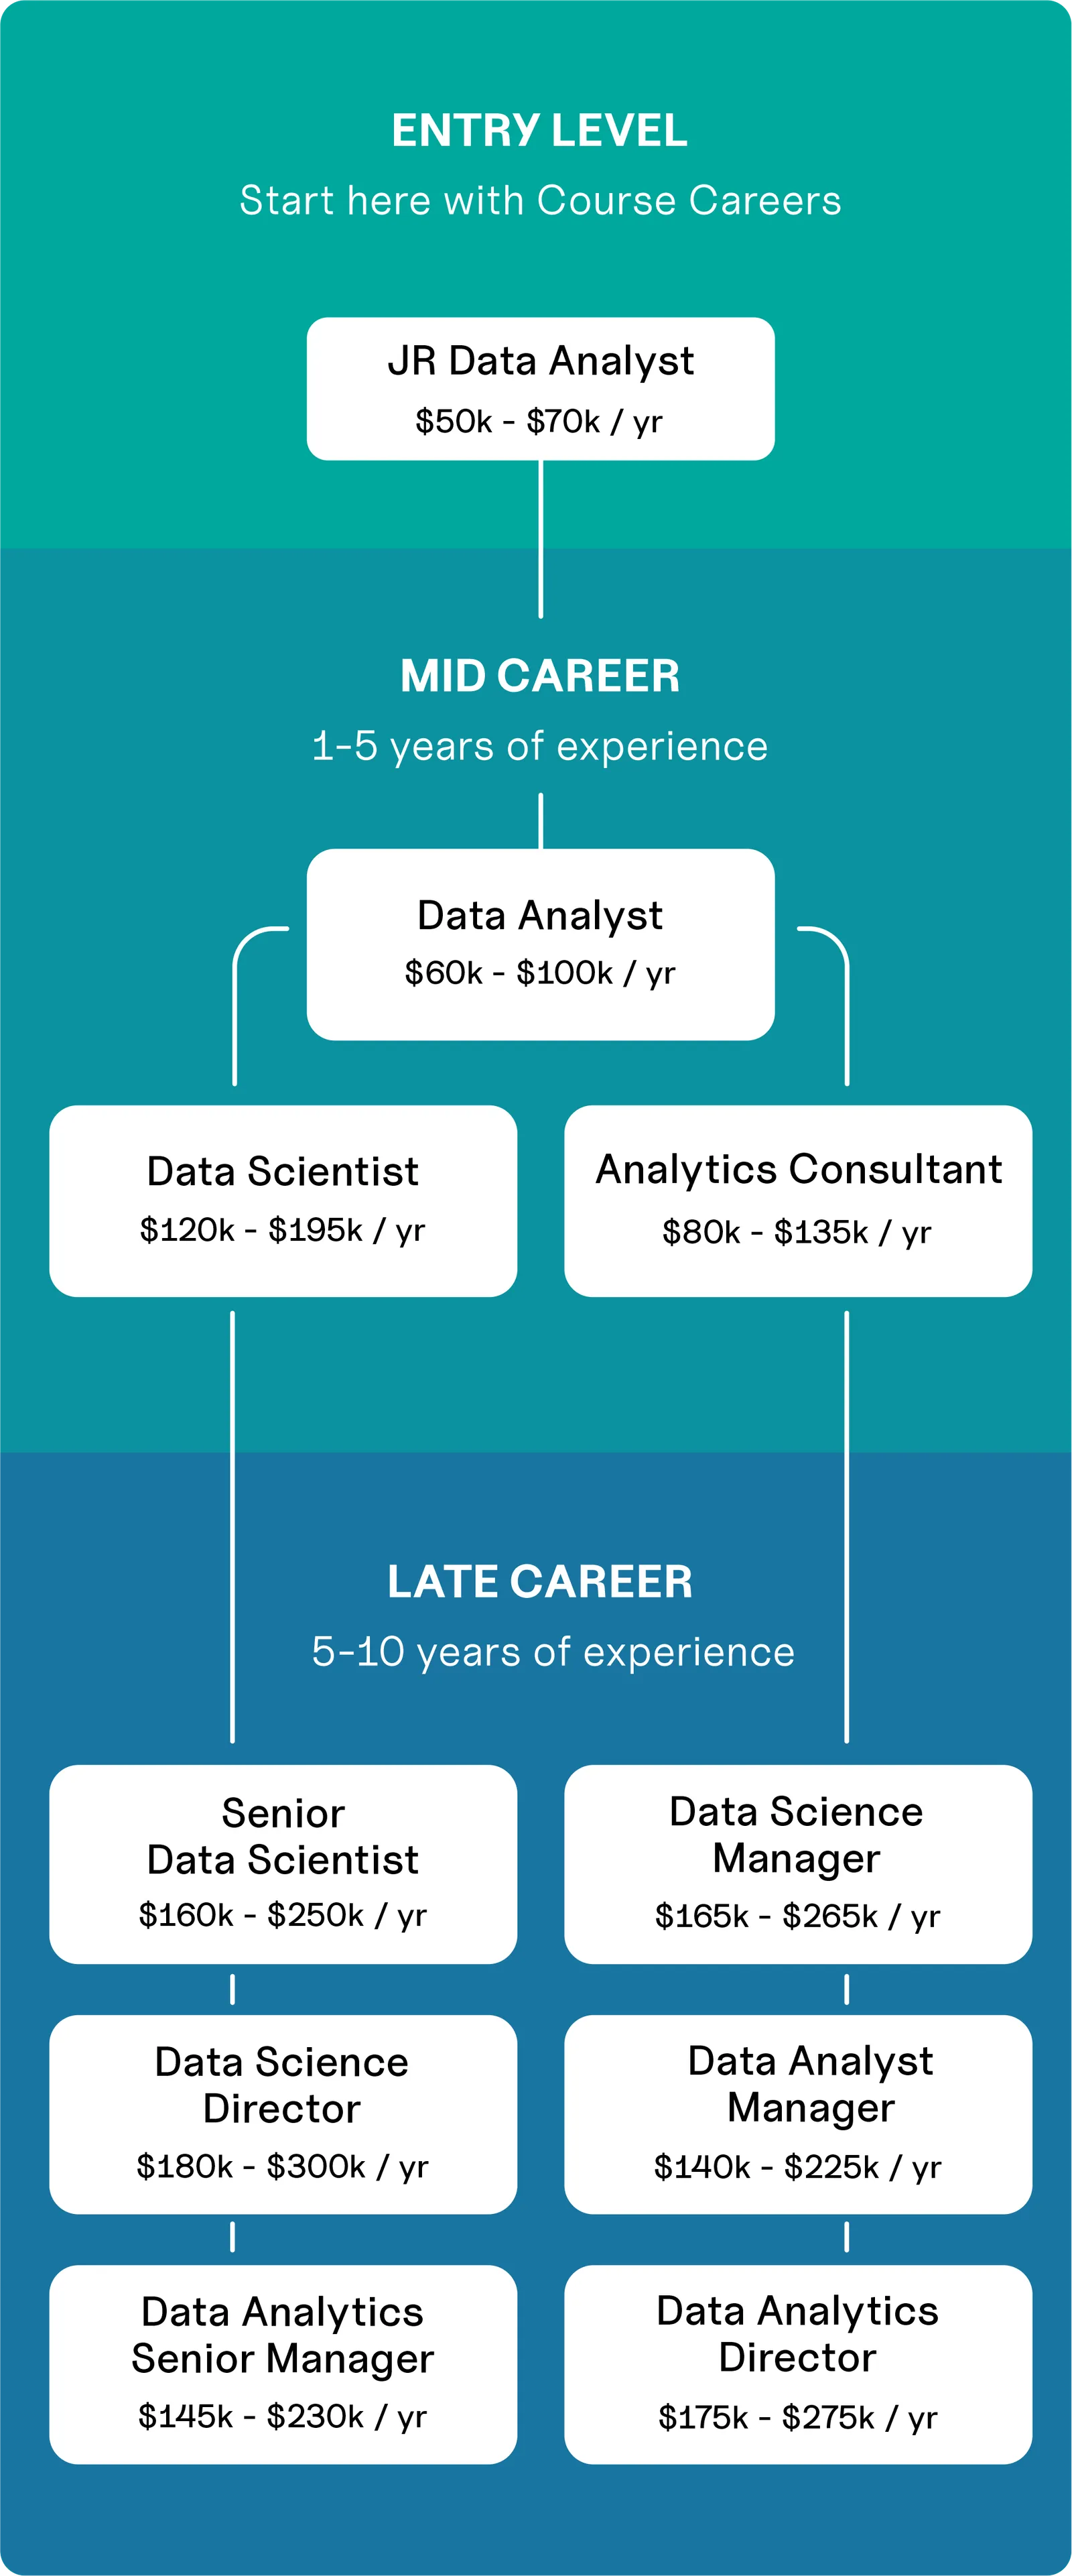
 Lucrative Career