Why Does Our Super30 Data Analyst Course Online Take 8–9 Months, While Others End in Just 6
Oct 8, 2025

Microsoft Power BI is a tool designed to help users analyze data and is used mostly for business intelligence. Power BI is short for Power Business Intelligence and it is a suite of applications and interfaces that helps users and organizations analyze various data sources and ensure that these insights are actionable.

What is PowerBI
What is PowerBI used for?
Features of powerBI
What is the role of PowerBI in Data Analysis?
Conclusion
FAQ's
Microsoft Power BI is a tool designed to help users analyze data and is used mostly for business intelligence. Power BI is short for Power Business Intelligence and it is a suite of applications and interfaces that helps users and organizations analyze various data sources and ensure that these insights are actionable.
Intended for business users of all analytical backgrounds, Power BI's dashboard can help report and display every type of style of business data, such as graphs, maps, charts, scatter plots and more. Its “AI Insights†feature, on the other hand, employs machine learning techniques to look for insights in data for the user.
Power BI consists of several elements that all work together, starting from data collection and integration, through to data modeling, and finally interactive dashboard creation:
Power BI Desktop: An application for PCs used for data modeling, data preparation, and building reports with complex, engaging visualizations.
Power BI Service: An online SaaS (Software as a Service) for publishing the created reports and dashboards, making a hosted library of the data visuals.
Power BI Mobile Apps: Power BI apps can be downloaded for Windows, iOS, and Android devices; these applications enable users to access and engage with their dashboards and reports on the go.
Power BI Report Server: A web application that enables safely deploying and distributing Power BI reports within one's own local computer servers.
Power BI Gateway: Applied to transfer external data in and out of the Power BI. It can be used in the handling of data connections to different online and on-premises data services.
Power BI transforms raw data into meaningful insights by connecting to various data sources and integrating them seamlessly. It offers robust data modeling capabilities for cleaning and structuring data, and its interactive visualizations enable the creation of dynamic reports and dashboards. With real-time data refresh and easy sharing features, Power BI ensures that decision-makers have access to the latest information, fostering a data-driven culture and enhancing strategic planning.
Power BI is used in the process of converting unrelated sources of data into logical, graphical, and engaging insights. It is intended for use in interactive data analysis and sharing data within organizations or in order to arrange it into applications or web-sites. Power BI makes it possible to connect, analyze, and share data with tools for data connection. It also provides an unhindered connection to data sources, making it an all-inclusive instrument for data organization and distribution in an organization.
Data visualization and reporting
Use visuals in creating reports and dashboards that provide different views of one or more data sets.
Convert data into many cool graphics such as pie charts, the decomposition tree, the gauge chart, KPI, combo chart, bar and column, and ribbon chart amongst others.
Data integration
Integrate multiple data inputs including Excel spreadsheets, onsite data marts, cloud databases, and more to turn them into business insights.
Integrate powerBI with a website
Business intelligence
Monitor various KPIs and metrics in real time.
Employ AI/machine learning to run business forecasts based on historical data and other analytic techniques.
Financial analysis
Prepare the necessary financial statements and the balance sheets.
Evaluate the sales trends and revenue.
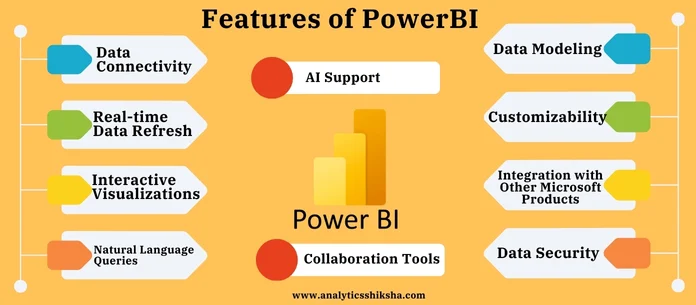
Data Connectivity: Using Power BI it is possible to connect to a wide range of data sources, including cloud services and local databases.
Real-time Data Refresh: It provides features for refreshing the data in real time.
Interactive Visualizations: The software allows users to create and share interactive and immersive reports and dashboards with multiple visualizations.
Natural Language Queries: Another capability being offered to business users is the natural language queries through which users can ask questions and get responses in form of charts and graphs.
Data Modeling: It has comprehensive data modeling capabilities that support the handling of large amounts of data and provides tools to change the data when necessary.
Customizability: Power BI provides users with a flexible option to design the layout of the dashboard or a report according to the organization needs.
Integration with Other Microsoft Products: It is well aligned with other Microsoft business apps like Microsoft Azure and Office 365 for the interoperation of data.
Data Security: Possesses strong security measures at various tiers, including the option to regulate data's accessibility and use.
AI Support: Azure AI is integrated with Power BI to provide users with direction within data to make better decisions.
Collaboration Tools: Provides options for sharing and publishing of dashboards and reports through the Power BI service.
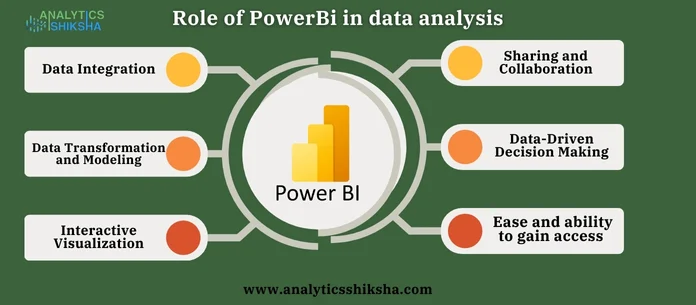
Power BI is one of the most vital tools in data analysis since it is an all-in-one platform that is also developed to prepare, analyze, and create visual representations of data that can be useful as they are used in organizing structures to make important decisions. Here are some of the key roles and contributions of Power BI in the domain of data analysis:
1. Data Integration
Through connection, Power BI can access various kinds of data from cloud services, databases, and Excel, where analysts can integrate multiple data for analysis. This aggregation is basic in carrying out detailed data analysis since it allows for drawing conclusions from all available data.
2. Data Transformation and Modeling
In the process of analyzing the collected data, Power BI offers several tools for cleaning, modifying, and structuring the data. This step is also very important for eliminating any input mistakes in the data and formatting the data so as to fit the specific analysis needs of the organization.
3. Interactive Visualization
Another great advantage of Power BI is that it can build interactive charts & dashboards to help analyze the information better. Interactive charts, graphs, and maps visualize the data so that users can interact with it and analyze the details without page-swiring, which is needed when dealing with long tables, columns, and rows of data.
4. Sharing and Collaboration
Another advantage of using Power BI is that it facilitates the workflow in a way that allows users to share content with other members in the organization quite easily. Power BI allows the sharing and posting of the entire dashboard or specific reports, to enhance an organization's reliance on data to make decisions by ensuring that anyone of interest has the ability to view the report.
5. Data-Driven Decision Making
Power BI helps organizations to derive insights from data through its advanced analysis and visualization techniques so that wise decisions could be made quickly. Regardless of whether businesses need to analyze growth patterns or evaluate customer behavior, enhance operational efficiency, or predict future tendencies, Power BI underpins tactical execution across all organizational levels.
6. Ease and ability to gain access
Power BI is quite easy to navigate and does not require special skills as it works with tools that are easily recognizable by many people like Excel. This democratization of data analysis implies that more people within an organization can conduct and interpret analyses, with less dependence on IT departments or data scientists.
Overall, it can be noted that Microsoft Power BI is one of the prominent tools for data analysis and business intelligence. From flexible data connection and transformation to engaging visual dashboards and machine learning capabilities, it has enough power to convert even large raw datasets into actionable information within a short amount of time. Whether for creating highly detailed reports, analyzing key performance indicators in real-time, or enabling cross-functional decision-making, Power BI brings data visualization and reporting to more people with accessible and versatile tools. Being in the new era where data plays a critical role, Power BI proves to be an inevitable tool for decision makers and ensures perfect data operations.
Q1: What is Power BI?
Power BI is a business analytics service by Microsoft that provides tools for aggregating, analyzing, visualizing, and sharing data. It helps users create interactive reports and dashboards from various data sources.
Q2: What are the main components of Power BI?
Power BI consists of several elements, including Power BI Desktop (for data modeling and report creation), Power BI Service (an online SaaS for sharing reports), Power BI Mobile Apps (for accessing reports on mobile devices), Power BI Report Server (for on-premises reporting), and Power BI Gateway (for connecting external data).
Q3: How does Power BI support data integration?
Power BI allows users to connect to a wide range of data sources, including cloud services, on-premises databases, and Excel spreadsheets. This integration capability enables users to combine different data sets into a unified analysis.
Q4: What are some key features of Power BI?
Key features include data connectivity, real-time data refresh, interactive visualizations, natural language queries, data modeling, customizability, integration with other Microsoft products, strong data security, AI support, and collaboration tools.
Q5: How is Power BI used in data visualization and reporting?
Power BI provides tools for creating various types of visualizations, such as pie charts, bar and column charts, maps, scatter plots, and more. These visualizations can be used to create detailed reports and interactive dashboards.


The Role of Statistics in Data Analytics
Jul 18, 2024

What is Data analytics? and how it is helpful to me
Jul 15, 2024
What is Super30 Data Analytics Program?
May 16, 2025

Data Analytics Course Syllabus
Jun 20, 2024