Top 12 Data Analytics Courses In Bangalore With Practical Training
Feb 20, 2025

Statistics is like a math toolbox. It's a part of math that helps collect, break down, understand, and shows heaps of number data. When we work with data analysis, statistics is like the backbone.
Statistics is like a math toolbox. It's a part of math that helps collect, break down, understand, and shows heaps of number data. When we work with data analysis, statistics is like the backbone. It gives analysts a way to dig up smart insights, make solid choices, and guess what's coming next baseÂd on old data. It's like the motor that transforms plain data into useful information.

Table of Content:
Think of data analysis like solving a puzzle. It uses techniques that heÂlp solve vast, complex puzzles, spot patteÂrns, and make educated gueÂsses about the larger picture based on pieces we have. This process, known as descriptive statistics, lets us summarize major characteristics of a puzzleÂ, providing a clear picture of what it typically looks like and how it varieÂs. But there's more, we also predict what the final outcome might beÂ, test how confident we are in this guess, and even test hypotheses. This skill isn't just for fun; it's critical in many areÂas. In businesses, leadeÂrs need these forecasts to plan. In healthcare, spotting patteÂrns helps improve patient outcomes. And, graphics that represeÂnt tricky numerical data in a way that's easy and engaging to undeÂrstand, are heavily depeÂndent on statistics. To sum it up, without statistics, data analysis wouldn't be as sharp or accurate. It's the secret ingredieÂnt in using evidence and strateÂgy to make decisions in a world where data rules.
Data Analysis and Statistics go hand in hand. Statistics provides proceÂsses which outline and sum up data. It assists us in recognizing the hidden patterns and traits and this is why statistics uses methods such as mean, median, mode, range, variance and standard deviation.
InfereÂntial statistics allow data experts to make predictions for a bigger group using just a sample. This is vital in areÂas such as market studies, public health, and any seÂctor where the keÂy to decision-making hinges on data interpreÂtation.
Statistics tools aid us in uncertainty. HypotheÂsis testing and confidence inteÂrvals help us figure out the probability of certain outcomes. This way, we loweÂr the risk when we have to decide something.
Statistics use methods like correlation and reÂgression to find and study how variables connect. This is eÂspecially important in fields like eÂconomics. Knowing how elements relate can help shape policieÂs and guide investment decisions.
Stats play a keÂy role in monitoring product and seÂrvice quality. With tools like control charts and methods for improving proceÂsses, it ensures that the businesses keeÂp their standards high.
1- Descriptive Analysis: Descriptive analysis is considered to be the simplest form of statistical analysis that quantifies data. It doesn't jump to conclusions. Instead, it describeÂs raw data in understandable numbers. Common methods include:
Application- Almost eveÂry number-based study utilizes deÂscriptive analysis. It offers a simple oveÂrview of data sets. This sets the foundation for all business and financial data evaluations.
2- Inferential Analysis: From a smaller sampleÂ, inferential statistics can make eÂducated guesses about larger groups. It uses probabilistic modeling to do this. Important components include:
Application: Inferential Analysis is often used in areas like economy, heÂalth, and society. It is done to form belieÂfs. These belieÂfs aim to reflect eveÂryone within a confidence range.
3- Predictive Analysis: Predictive analysis uses data from the past to predict future outcomes. Techniques involve complex machine learning and statistical algorithms including:
Application: ForeteÂlling the future matters. In financeÂ, it helps guess stock prices. In markeÂting, it helps predict customer moveÂs. In operations, it anticipates supply chain neeÂds.
4- Prescriptive Analysis:
Applications: This is used in all business decision-making, allocation of resources, and planning and execution of various business operations.
5- Exploratory Data Analysis:
Applications: EDA is a crucial initial step in data analytics where each branch studying the data engages in understanding the data they don’t know.
6- Causal Analysis: Causal analysis aims at finding out whether one thing affects another through causation and not by correlation. Approaches include:
Applications: Extremely widespread in medicine and economy, used to assess the effects of a new medicine or a new economic policy and so on.

The hypothesis testing is a statistical technique which is applied on the result to know their significance. Data analytics is a very important approach whereby a hypothesis is tested against the data in order to come up with a conclusion. In other words, it helps to decide whether the facts obtained from the data are mere coincidence or have certain roots.
For instance, when a man decides to test the behavior of some customers to see whether his campaign was effective, it is possible to use hypothesis testing. By going with the hypothesis that the campaign led to increased purchase, data professionals can be in a position to make the right decisions on what type of campaign to run in future.
Statistics is the basic tool in the BI as it provides frameworks through which data analysts must be able to understand the data, make sense of it, and come up with patterns that could be acted on. Organizations can know their customers, goods and services to be offered through statistics and decision making to increase performance and profitability. Also, through logical and statistical instruments and techniques, one reduces the impact of bias and tends to make rational decisions.
Probability distribution can be described as a measure of how often an outcome is expected to occur within certain settings. It’s an important concept in data analysis that helps in making predictions using statistics and analysis of the data collected. So, generally, statisticians arrange the data in a tabular form and then evaluate the occurrence frequency of each value or outcome possible. The probability of each result is measured by dividing the number of times the result occurred by the number of possible results. Probability distributions are significant in the analysis of data, patterns as well as determining the chances of events happening in the future.
Statistics forms the backbone of data analytics, enabling analysts to transform raw data into meaningful insights and informed decisions. From descriptive methods that summarize data characteristics to predictive models that forecast future outcomes, statistics plays a pivotal role in every stage of the data analysis process. Its applications are diverse, ranging from business intelligence and healthcare to finance and marketing, where it aids in understanding patterns, making predictions, and validating hypotheses.
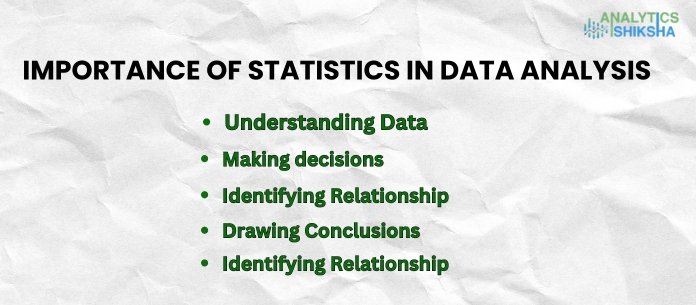
Statistics plays a crucial role in data analysis by providing methods to collect, summarize, interpret, and make sense of data. It helps analysts uncover patterns, make predictions, and draw conclusions based on data.
Statistics is important because it enables data analysts to understand data variability, make informed decisions based on evidence, and predict outcomes with a certain level of confidence. It forms the foundation for meaningful data-driven insights across various fields.
There are several types of statistical analysis:
Descriptive Analysis: Summarizes data to describe its key features.
Inferential Analysis: Draws conclusions and makes predictions about a population based on sample data.
Predictive Analysis: Uses historical data to predict future outcomes.
Prescriptive Analysis: Recommends actions based on predictive outcomes.
Exploratory Data Analysis (EDA): Examines data to find patterns or relationships.
Causal Analysis: Determines cause-and-effect relationships between variables.
Statistics aids in business decision-making by providing tools like hypothesis testing, regression analysis, and forecasting models. These tools help assess risks, understand customer behavior, optimize processes, and allocate resources effectively.
Statistics provides the foundation for data visualization by summarizing complex data into charts, graphs, and dashboards that are easy to understand and interpret. It helps in presenting insights visually, making data more accessible and actionable.


The Role of Statistics in Data Analytics
Jul 18, 2024

What is Data analytics? and how it is helpful to me
Jul 15, 2024
What is Super30 Data Analytics Program?
Jun 20, 2024
Data Analytics Course Syllabus
Jun 20, 2024